
KEMETIC MINDS
Data Journalism — Economics Series | July 20, 2026
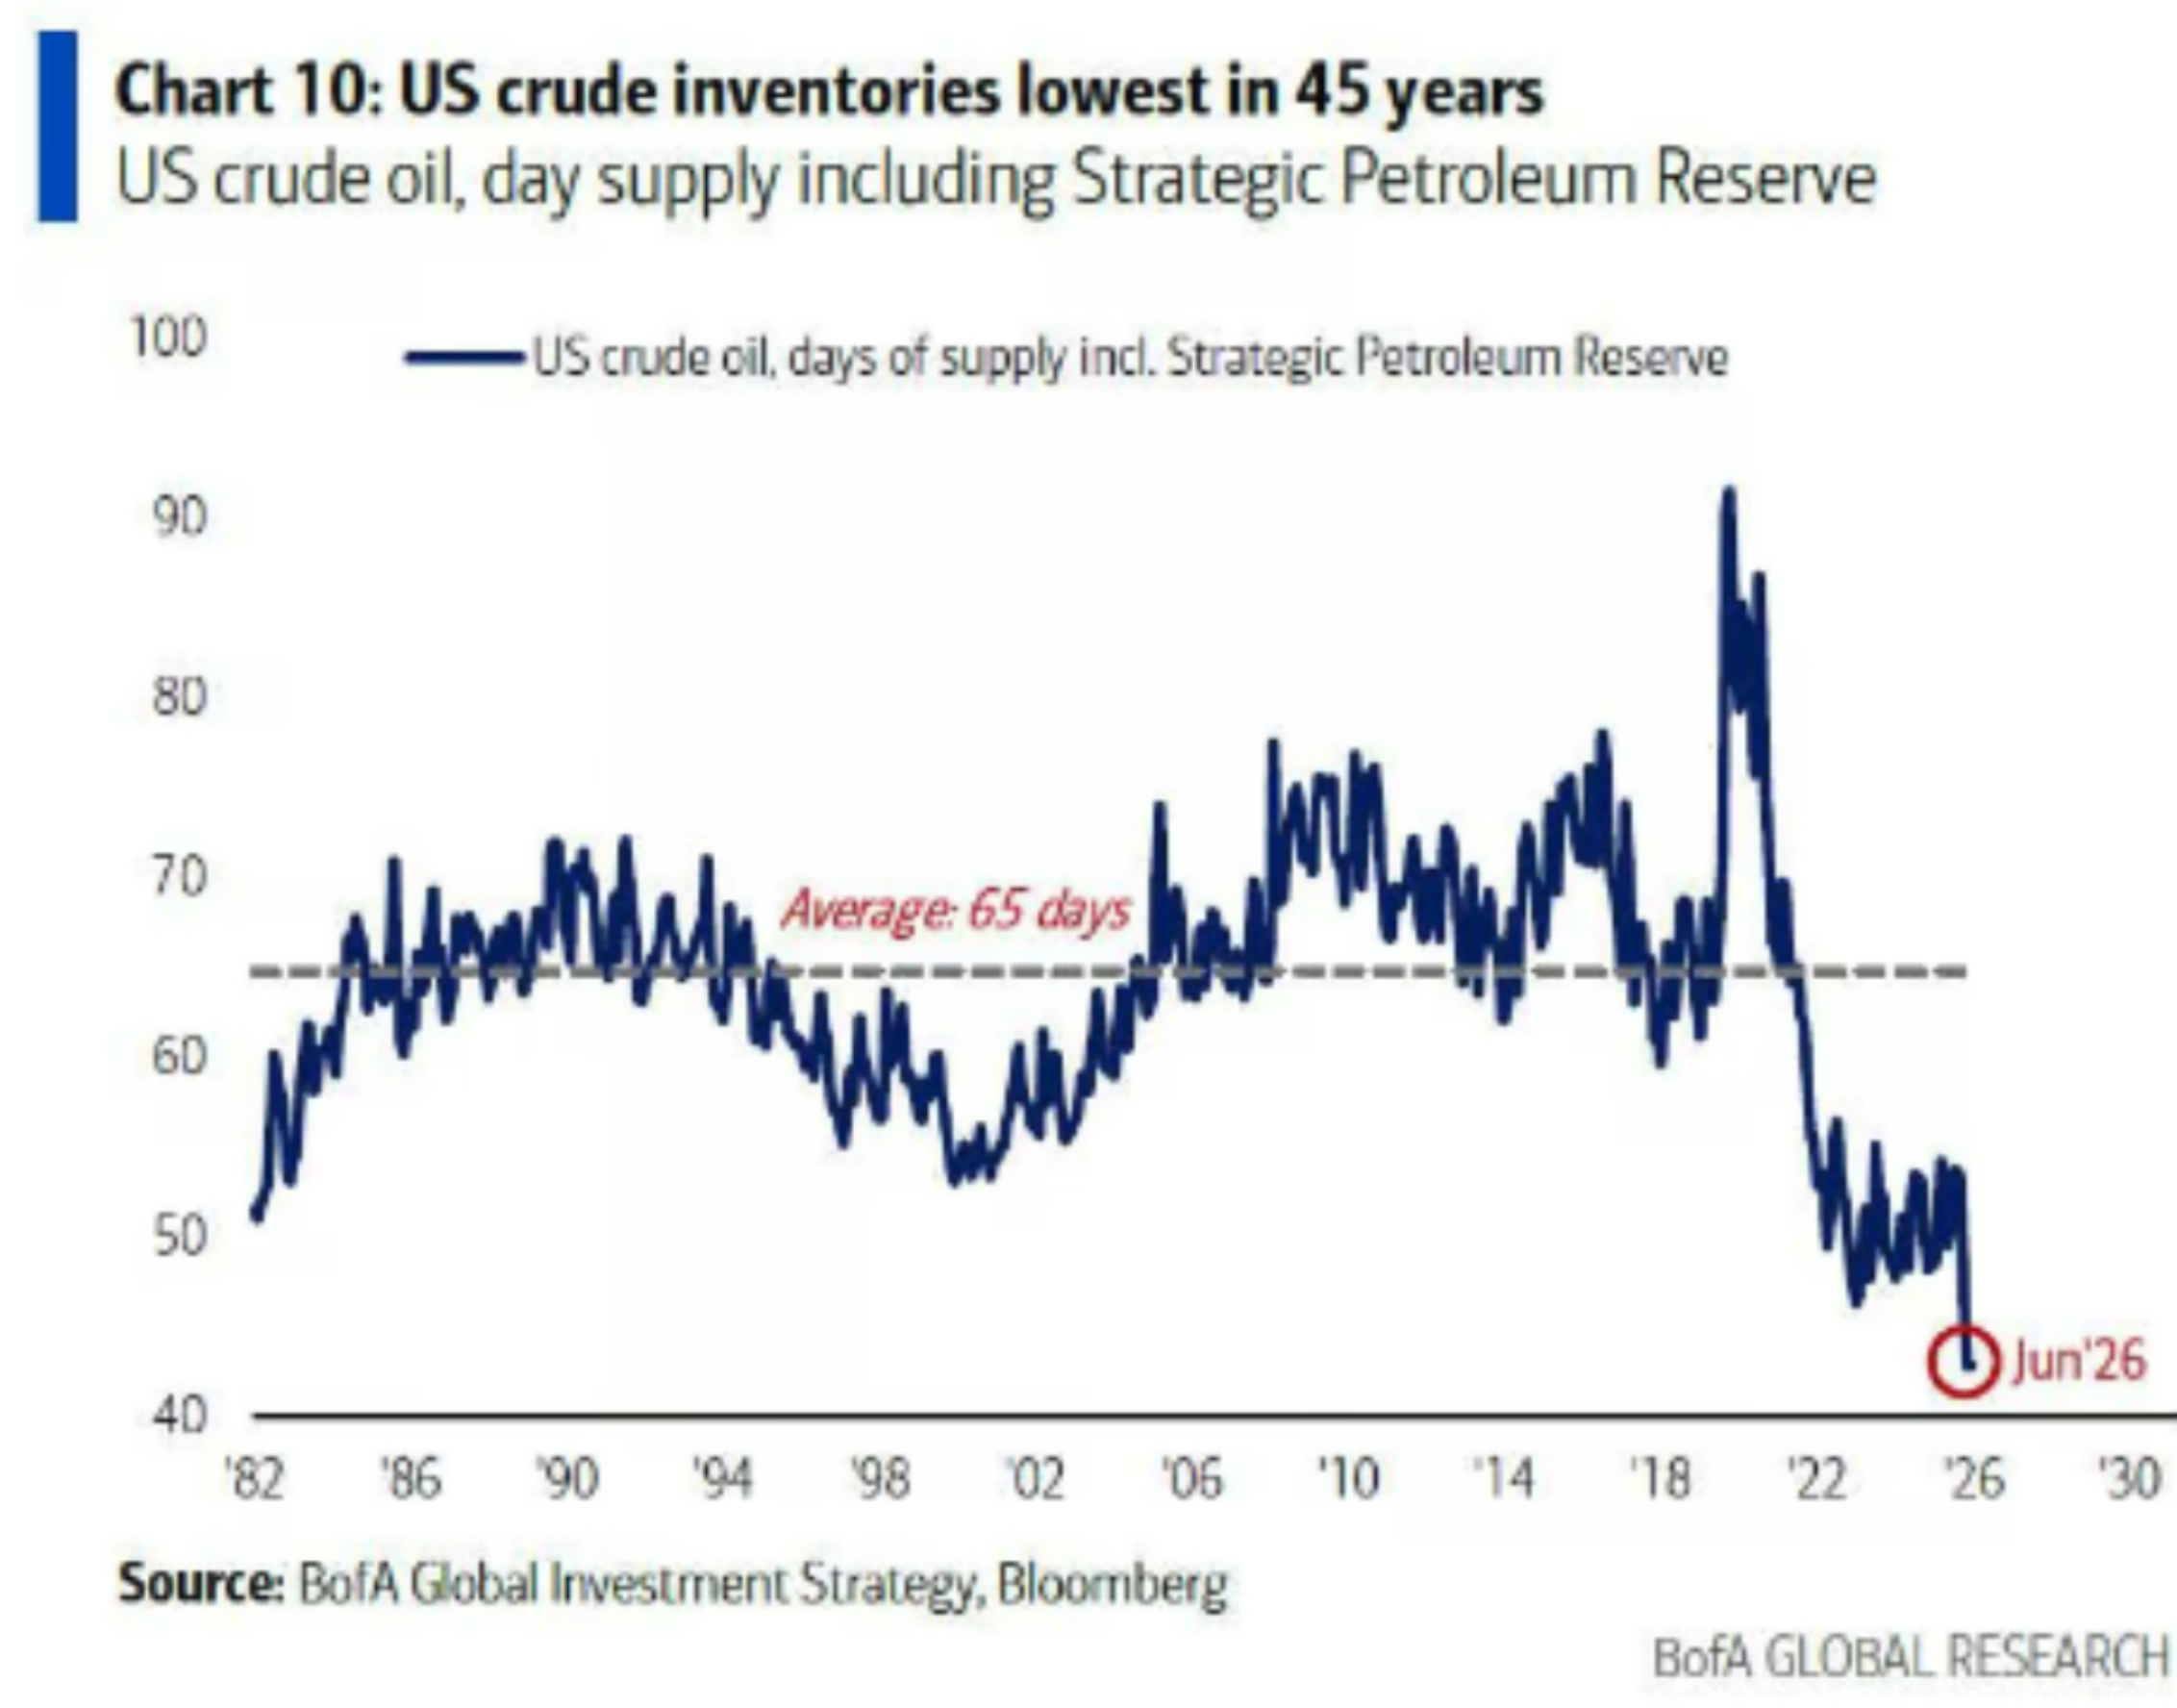
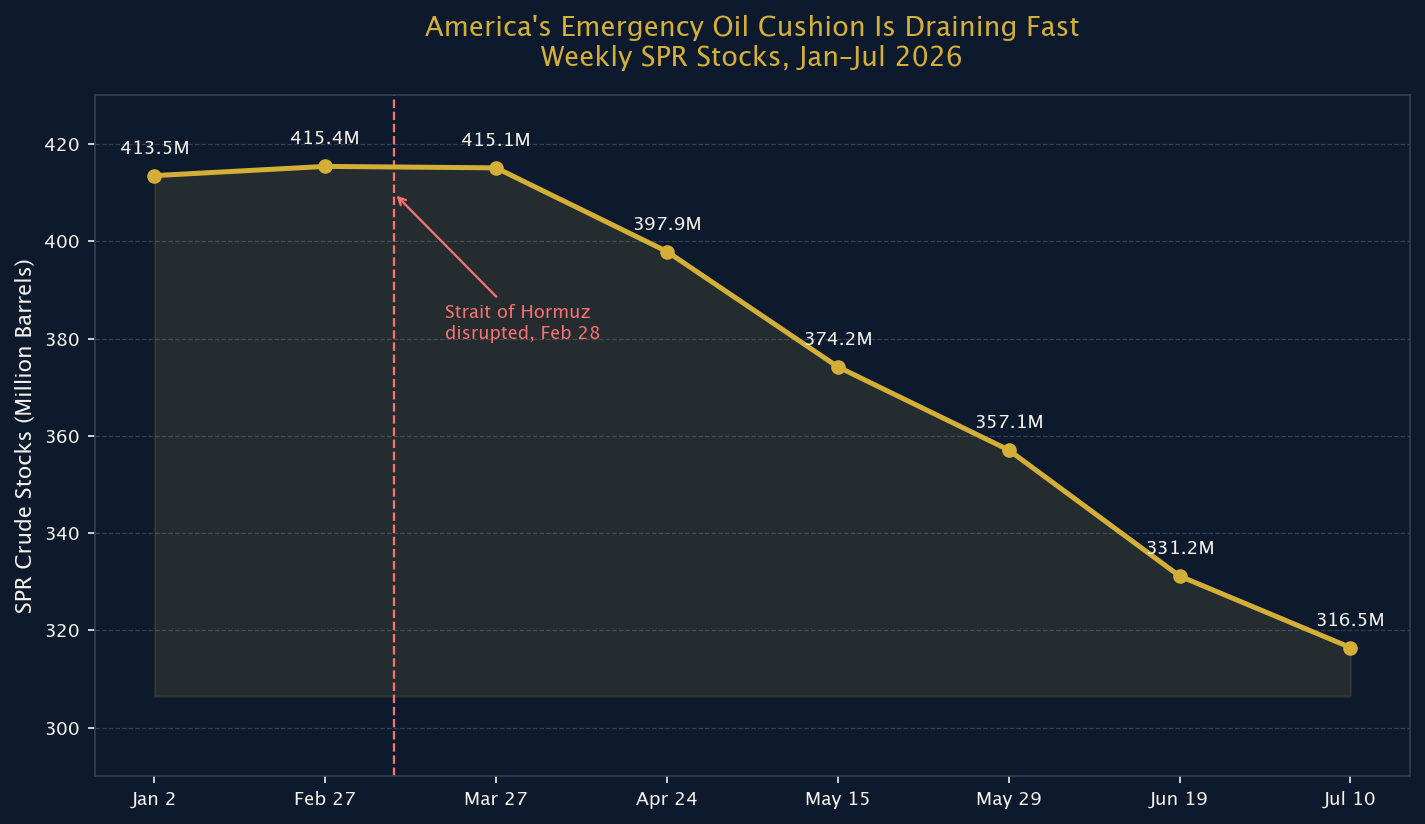
A BofA Global Investment Strategy chart, built on Bloomberg data, shows U.S. crude oil days of supply — including the Strategic Petroleum Reserve — at its lowest level in 45 years as of June 2026. EIA’s own weekly data confirms the trend directly: the SPR has fallen from roughly 415 million barrels in late February to 316.5 million barrels by July 10, a 23.8% drop in under five months, following the Strait of Hormuz’s disruption on February 28. Now a second choke point has gone dark. On July 20, 2026, Yemen’s Houthi forces declared a naval blockade of Bab-el-Mandeb, the strait connecting the Red Sea to the Gulf of Aden and roughly 5–7% of global oil exports. Here’s what the inventory data actually shows, what a two-strait disruption could mean for oil markets, and what it already means for the average American family’s monthly budget.
1. The Chart: A 45-Year Low in America’s Oil Cushion
The chart below, published by BofA Global Investment Strategy using Bloomberg data, tracks U.S. crude oil days of supply — a measure of how many days current inventories, including the Strategic Petroleum Reserve, could cover national consumption without any new production or imports. Since 1982, that figure has averaged 65 days. As of the chart’s June 2026 data point, it had fallen to its lowest reading in the 45-year series, well below both the historical average and the low points reached during the 2021–2022 pandemic-recovery inventory squeeze.
Figure 1
US Crude Inventories Lowest in 45 Years
That is not a one-source anomaly. EIA’s own weekly Petroleum Status Report tells the same story from the raw barrel counts: commercial crude oil inventories (which exclude the SPR) stood at 412.1 million barrels for the week ending June 19, 2026 — 7% below the five-year seasonal average (U.S. Energy Information Administration, 2026a). Layer the Strategic Petroleum Reserve on top, and the picture gets worse, not better: the SPR itself has been falling every single week since late February.
2. How We Got Here: The First Strait
The SPR held a stable 413–415 million barrels through January, February, and most of March 2026 — essentially flat for months. Then it started dropping, fast. EIA’s weekly series shows the reserve at 415.1 million barrels on March 27, down to 397.9 million by April 24, 374.2 million by mid-May, and 316.5 million barrels by the week ending July 10 (U.S. Energy Information Administration, 2026b). That’s a decline of roughly 99 million barrels — 23.8% of the reserve — in under five months, and it puts the SPR at its lowest level since the early 1980s, not far above the roughly 316 million barrels held before the reserve’s historic peak of 726.6 million barrels was even reached in December 2009 (U.S. Department of Energy, 2026).
The trigger was the Strait of Hormuz’s disruption on February 28, 2026, as the U.S.-Iran conflict escalated and traffic through the world’s single most important oil chokepoint — a waterway that normally carries roughly a quarter of global seaborne oil trade — became unreliable. Washington and its allies responded the way they’re designed to: releasing emergency barrels from strategic stockpiles to keep supply flowing and prices in check while shipping routes were disrupted. That response worked as intended in the narrow sense that gas lines didn’t form — but it came at the direct cost of the exact emergency cushion that exists for a moment like this one, at the exact moment a second one is arriving.
Figure 2
America’s Emergency Oil Cushion Is Draining Fast
3. The Second Strait: Bab-el-Mandeb Goes Dark
On Monday, July 20, 2026, Yemen’s Houthi forces declared a naval blockade against Saudi Arabia, effective immediately, through the Bab-el-Mandeb Strait — the narrow, 29-kilometer-wide chokepoint connecting the Red Sea to the Gulf of Aden. The group framed the move as retaliation for what it called Saudi Arabia’s 12-year blockade of Yemen, following Saudi strikes on Sanaa’s airport (Al Jazeera, 2026a). In June 2026 alone, roughly 7.4 million barrels of oil per day transited the strait — about 7% of global oil output — and Saudi Arabia’s Red Sea export terminal has been shipping about 4 million barrels a day, triple its year-earlier volume, making the kingdom especially exposed to any closure (Al Jazeera, 2026a). Read the full timeline of the blockade declaration and its immediate fallout in our companion coverage here.
Analysts are blunt about what a simultaneous closure of both chokepoints would mean: with Hormuz already disrupted, a full Bab-el-Mandeb shutdown could restrict roughly 25% of the world’s combined oil and gas supply (Al Jazeera, 2026a; Eastpost, 2026). Brent crude, which had been trading around $86 a barrel in mid-July, jumped nearly 4% overnight and topped $90 a barrel on July 20 after the U.S. confirmed American service members had died in fighting with Iran — a direct, same-day market reaction to the compounding chokepoint risk (Bloomberg, 2026; CNBC, 2026). Modeling from maritime and trade analysts suggests that if both waterways were blocked concurrently for an extended period, oil could climb toward $100–120 a barrel, supply-chain delays of 10–15 days could hit just-in-time manufacturing, and Europe’s annual energy bill alone could rise by an estimated €200–300 billion (Eastpost, 2026).
4. What It Means for the Average Family’s Budget
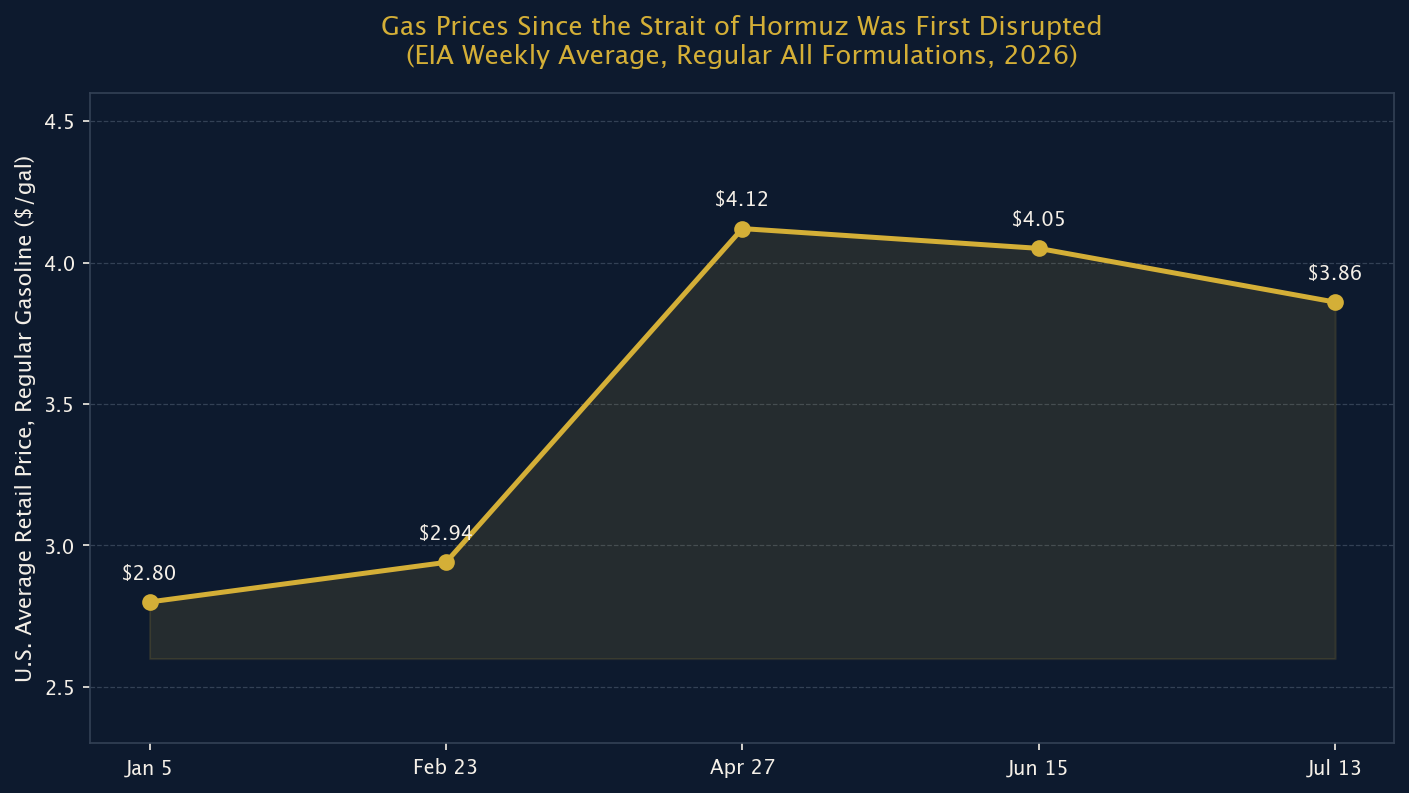
This isn’t an abstract commodities story. EIA’s weekly retail gasoline series shows the national average price for regular gasoline at $2.80 a gallon in the first week of January 2026, still just $2.94 in late February — the week before Hormuz was disrupted. By late April, after the Hormuz shock worked its way through the supply chain, the average had jumped to $4.12 a gallon. It eased slightly to $3.86 by mid-July, but that’s still $1.06 a gallon — 38% — above where it started the year (U.S. Energy Information Administration, 2026c). AAA’s more current daily tracker put the national average even higher, at $3.95 a gallon as of mid-July (AAA, 2026), and that was before the Bab-el-Mandeb blockade was even declared.
Figure 3
Gas Prices Since the Strait of Hormuz Was First Disrupted
Run the math on an ordinary commute and it adds up fast. The Federal Highway Administration puts the average American driver’s annual mileage at roughly 13,500 miles a year; combined with the current on-road vehicle fleet’s real-world average fuel economy of about 26 miles per gallon, that works out to roughly 519 gallons consumed a year per driver (U.S. Department of Transportation, Federal Highway Administration, 2026; U.S. Environmental Protection Agency, 2026). At the $1.06-a-gallon increase seen since January, that’s an extra $550 a year — about $46 a month — for a single driver, before accounting for a second car, a longer commute, or a summer road trip. For a two-driver household, that’s closer to $90–100 extra a month, money that isn’t going toward groceries, rent, or savings.
The public-opinion data backs up that this is registering as a real financial strain, not background noise. A Pew Research Center survey found 69% of Americans worried about higher gas prices tied to the Iran conflict, and 73% held oil and gas companies at least partly responsible for the increase (Pew Research Center, 2026). Separately, Ipsos polling found two-thirds of Americans say rising gas prices have already affected their household finances, with nearly six in ten driving less and close to half changing their summer travel plans as a direct result (Ipsos, 2026). Those numbers were collected before the Bab-el-Mandeb blockade added a second live threat to the same supply chain.
5. What Families Can Actually Do Right Now
None of the underlying geopolitics is something an individual household can control, but a few concrete, low-effort steps can blunt the impact of continued volatility at the pump.
1. Build the volatility into your monthly budget now, not after the next spike. Based on the swings already seen this year — from $2.80 to $4.12 and back to $3.86 — a household that budgets for gas at the higher end of that range, rather than the lower end, won’t be caught off guard if Bab-el-Mandeb escalation pushes prices up again.
2. Bundle errands and reduce discretionary driving. Ipsos found nearly six in ten Americans have already cut back on driving in response to prices (Ipsos, 2026); consolidating trips is the most immediate, zero-cost way to reduce gallons purchased per month.
3. Check employer commuter benefits before assuming there aren’t any. Many employers offer pre-tax commuter/transit benefit programs that are underused simply because employees don’t ask; even a partial subsidy offsets some of the per-gallon increase documented above.
4. Time larger purchases and road trips around price dips, not calendar dates. EIA’s weekly series shows prices eased from their April peak through the summer before this latest escalation; near-term dips, when they occur, are a better window for fuel-heavy travel than a fixed date on the calendar.
Kemetic Minds Analysis
The throughline in the primary-source data is straightforward: the U.S. drew down its own emergency oil cushion by nearly a quarter in under five months to absorb the shock from a single disrupted chokepoint, and now a second one has gone dark on the same day this reserve level was confirmed at a 45-year low. That sequencing matters. Emergency reserves exist precisely for moments of compounding risk, and the tool that would normally be reached for first — another coordinated release — has less room to work with than at any point since the early 1980s. None of this guarantees a worst-case outcome; Hormuz and Bab-el-Mandeb have both been disrupted before without a full simultaneous closure materializing. But the family-budget math doesn’t require a worst case to already hurt: gas is 38% more expensive than it was in January, two-thirds of Americans say it’s already affecting their finances, and the inventory data that would normally cushion the next shock is thinner than it has been in 45 years.
For continuing coverage of the two chokepoints driving this story, see our reporting on the Strait of Hormuz disruption, the Bab-el-Mandeb blockade declaration, and our companion piece on what Big Oil’s earnings mean for the average American at the pump.
References
- AAA. (2026, July). Gas prices. AAA Fuel Prices. gasprices.aaa.com
- Al Jazeera. (2026a, July 20). Yemen’s Houthis declare naval blockade of Saudi Arabia: What to know. aljazeera.com
- Al Jazeera. (2026b, July 14). Oil prices hit 1-month high as US-Iran attacks dim Strait of Hormuz outlook. aljazeera.com
- Bloomberg. (2026, July 19). Latest oil market news and analysis for July 20. bloomberg.com
- BofA Global Investment Strategy. (2026). Chart 10: US crude inventories lowest in 45 years [Chart]. Bloomberg.
- CNBC. (2026, July 20). Oil prices rise after Trump says Iran will pay for killing U.S. service members. cnbc.com
- Eastpost. (2026, July). Double choking: Strait of Hormuz, Bab-el-Mandeb escalation signals global supply chain crisis. eastpost.in
- Ipsos. (2026). Two-thirds say rising gas prices have affected their household finances. ipsos.com
- Pew Research Center. (2026, April 7). Gas prices are Americans’ top concern in Iran war. pewresearch.org
- U.S. Department of Energy. (2026). SPR quick facts. energy.gov
- U.S. Department of Transportation, Federal Highway Administration. (2026). Highway statistics: Annual vehicle miles traveled. fhwa.dot.gov
- U.S. Energy Information Administration. (2026a). U.S. commercial crude oil inventories have decreased in June [Today in Energy]. eia.gov
- U.S. Energy Information Administration. (2026b). Weekly U.S. ending stocks of crude oil in SPR [Data table]. eia.gov
- U.S. Energy Information Administration. (2026c). Weekly U.S. regular all formulations retail gasoline prices [Data table]. eia.gov
- U.S. Environmental Protection Agency. (2026). Automotive trends report: Fleet-wide fuel economy. epa.gov
Methodology: The lead chart is reproduced from BofA Global Investment Strategy (Bloomberg data). Every U.S. inventory and price figure cited in the text was independently pulled directly from the U.S. Energy Information Administration’s public weekly data tables and Today in Energy briefs, not estimated or rounded from search snippets. Strategic Petroleum Reserve historical-peak and program figures come from the U.S. Department of Energy’s official SPR Quick Facts page. Driving-cost estimates combine Federal Highway Administration average annual mileage with EPA fleet-wide fuel economy data. Geopolitical and market reporting is drawn from Al Jazeera, Bloomberg, and CNBC. Public-opinion figures come from Pew Research Center and Ipsos. No figures were sourced from Wikipedia. Citations follow APA 7th edition format.
📱 Stay Connected

Kemetic Minds Editorial Desk
Verified NewsroomPrimary-sourced investigative intelligence on civil rights, voting rights, federal policy, and consumer protection. Sourced from primary legal filings, government statistics, and direct field reporting.