
KEMETIC MINDS
Data Journalism — Economics Series | July 20, 2026
Big Oil’s post-2021 profit boom has cooled from its 2022 record but remains historically high, while the two U.S. supermajors paid their CEOs 200 to 232 times what their median employee earned in the most recent disclosed fiscal year. Meanwhile, the average American is paying more at the pump than in any pre-2021 year on record, and two-thirds say rising gas prices are straining their household budget. Here’s what the primary-source numbers show, and the legitimate, low-effort ways ordinary investors can position around oil-price swings instead of just absorbing them.
1. The Profit Story: A Record Year, Then a Slow Fade
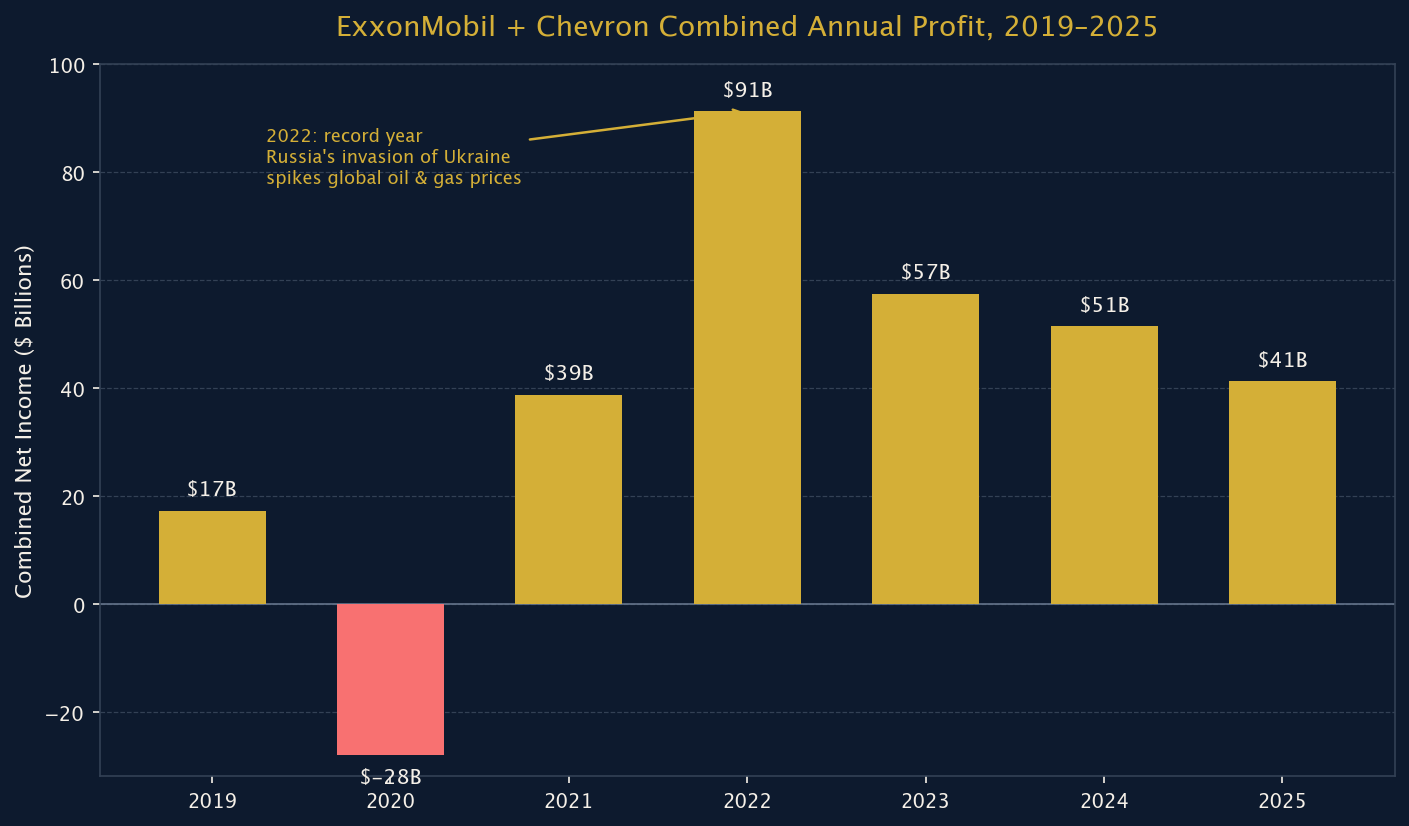
2022 was the best year in the history of the American oil industry. Russia’s full-scale invasion of Ukraine in February of that year sent global crude and natural gas prices soaring, and ExxonMobil alone posted $55.74 billion in net income — the highest annual profit ever recorded by a Western oil major. Chevron added another $35.5 billion. Combined, the two U.S. supermajors earned more than $91 billion in a single year, more than triple their combined 2020 pandemic-era loss of roughly $28 billion (ExxonMobil Corporation, 2021, 2023; Chevron Corporation, 2023).
That 2022 peak has not repeated since — profits fell in 2023, again in 2024, and again in 2025 as oil and natural gas prices normalized. ExxonMobil earned $28.8 billion in 2025, its lowest total since 2021; Chevron earned $12.4 billion, down 32% from 2024 (ExxonMobil Corporation, 2026; Chevron Corporation, 2026). But “lower than the record” is not the same as “low.” Every year from 2021 through 2025, the combined ExxonMobil-Chevron profit total exceeded the companies’ full pre-pandemic 2019 baseline of roughly $17 billion — in several years, by a factor of three or more.
Figure 1
ExxonMobil + Chevron Combined Annual Profit, 2019–2025
2. CEO Pay vs. the Median Worker
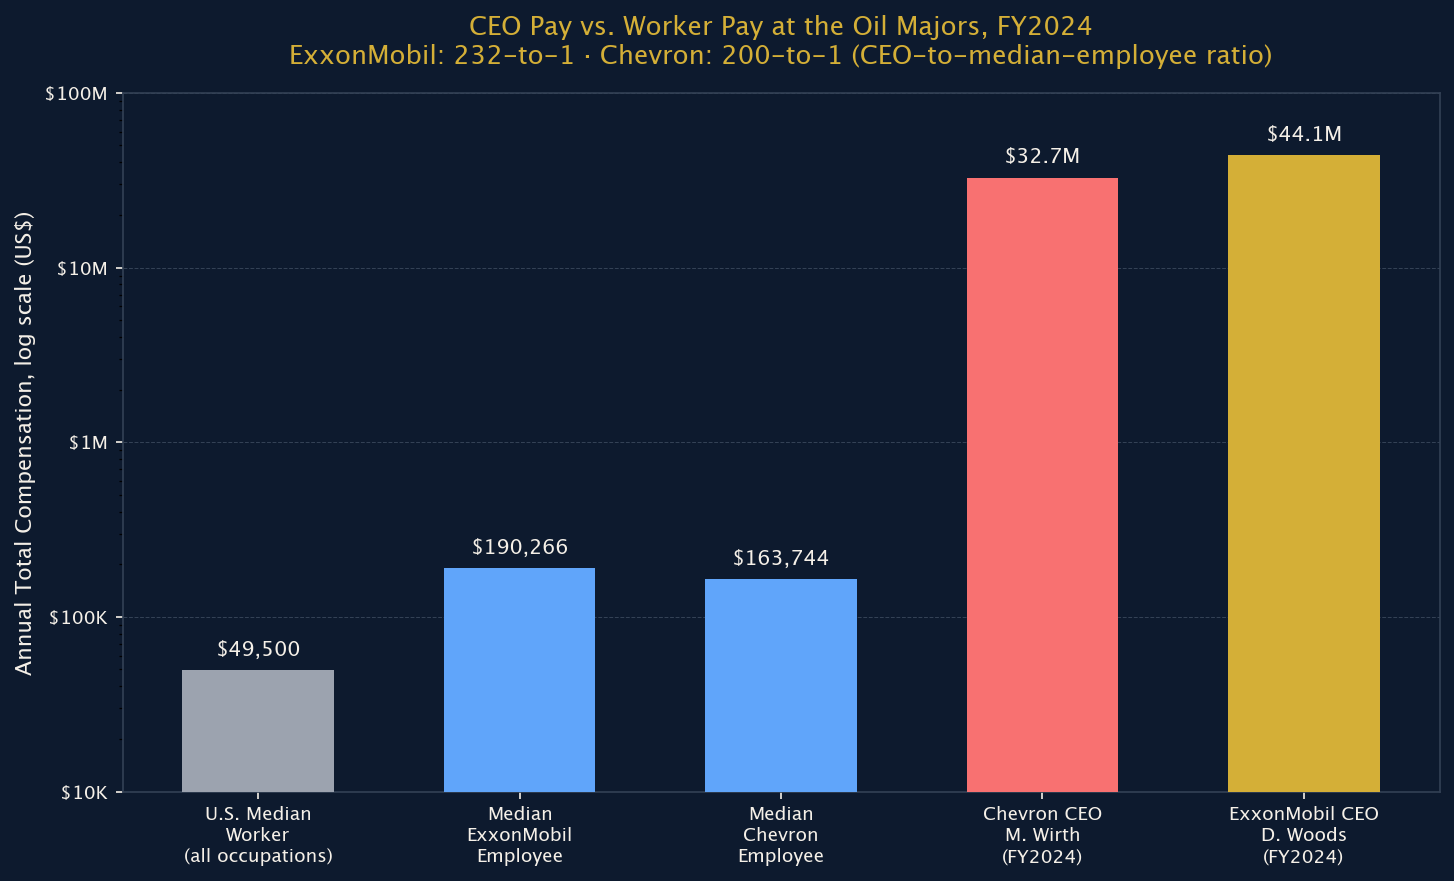
Both companies disclose a federally mandated CEO pay ratio in their annual proxy statements. In the most recently filed disclosure, ExxonMobil reported CEO Darren Woods’ total compensation at $44,100,504 against a median ExxonMobil employee total of $190,266 — a ratio of 232-to-1. Chevron reported CEO Michael Wirth’s total compensation at $32,716,940 against a median employee total of $163,744, a ratio of 200-to-1 (Exxon Mobil Corp., 2025; Chevron Corp., 2025). Both companies’ pay ratios were calculated under SEC Item 402(u) rules, using each firm’s full global workforce as of the relevant measurement date.
It’s worth noting that ExxonMobil and Chevron’s own median employee ($190,266 and $163,744, respectively) already earns roughly triple the median wage across all U.S. occupations, which the Bureau of Labor Statistics put at $49,500 in its most recent Occupational Employment and Wage Statistics release — oil and gas extraction is genuinely one of the highest-paying industries in the country (U.S. Bureau of Labor Statistics, 2026). The gap that matters here isn’t oil workers versus everyone else; it’s the CEO versus everyone else, including the company’s own well-paid workforce. Both companies’ 2025 fiscal-year CEO pay actually fell from the prior year — Woods’ total pay dropped about 25% to roughly $33.0 million and Wirth’s fell to roughly $25.7–26.8 million, tracking the broader decline in company profits (Moomoo, 2026; TradingView/Reuters, 2026) — but even a down year for a supermajor CEO remained worth well over 100 median employees’ full annual pay.
Figure 2
CEO Pay vs. Worker Pay at the Oil Majors, FY2024
3. What It Means at the Pump
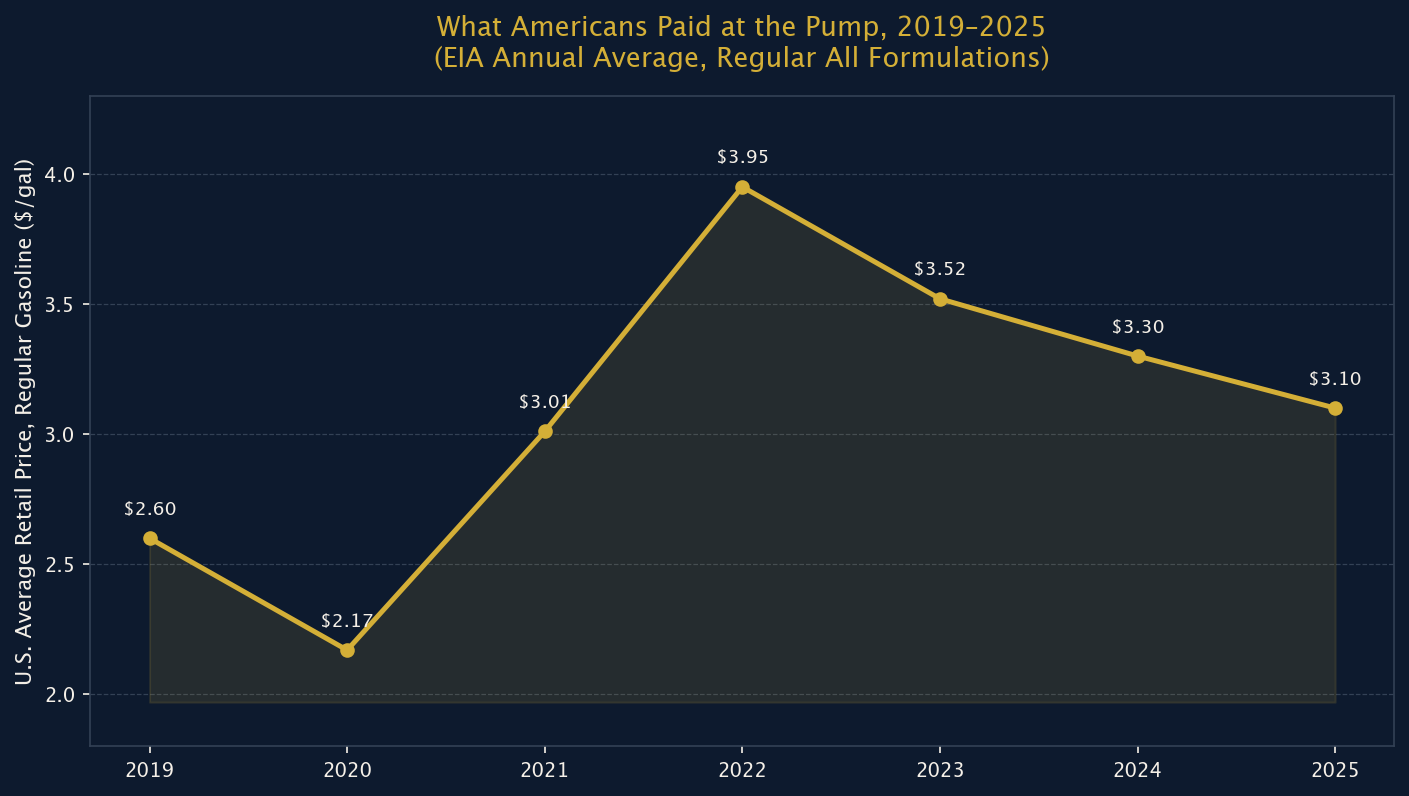
U.S. Energy Information Administration data show the national annual average price of regular gasoline was $2.60 a gallon in 2019, dropped to $2.17 during the 2020 pandemic demand collapse, then jumped to a record $3.95 in 2022 before easing to $3.10 in 2025 (U.S. Energy Information Administration, 2026). By early-to-mid July 2026, AAA’s daily tracker put the national average back up near $3.94 a gallon, driven by instability in the Strait of Hormuz and renewed conflict-driven volatility in crude markets (AAA, 2026).
That volatility registers directly with consumers. A Pew Research Center analysis published in April 2026 found gas prices were Americans’ single top financial concern tied to the Iran war, with 69% saying they were worried about higher prices at the pump and 73% holding oil and gas companies at least partly responsible for the increase (Pew Research Center, 2026a). A companion Pew report on shifting U.S. energy attitudes found continued public skepticism that fossil-fuel producers are pricing fairly, even as the share of Americans prioritizing oil and gas production over renewables has grown (Pew Research Center, 2026b). Separately, Ipsos polling found two-thirds of Americans say rising gas prices have affected their household finances, with nearly six in ten driving less and close to half changing summer travel plans as a direct result (Ipsos, 2026).
Figure 3
What Americans Paid at the Pump, 2019–2025
4. Simple, Legitimate Ways Everyday People Can Position Around Oil-Price Moves
None of this is investment advice, and oil and gas prices can fall as quickly as they rise — but there are a handful of low-effort, well-documented ways ordinary people already gain some exposure to the same price swings that are showing up at the pump, rather than only absorbing the cost side of them.
1. Broad energy-sector index funds. The Energy Select Sector SPDR Fund (ticker: XLE) is the largest and most heavily traded U.S. energy ETF, holding a basket of major oil, gas, and refining companies including ExxonMobil and Chevron; it currently yields about 2.85% in dividends on top of any share-price movement tied to energy prices (State Street Global Advisors, 2026). Buying a single share provides diversified exposure without having to pick individual oil stocks.
2. Dividend income from the majors themselves. Both ExxonMobil ($4.12/share annually, about a 2.8% yield) and Chevron ($7.12/share annually, about a 3.8% yield) have paid and grown dividends for decades, including through the 2020 loss year — a track record few S&P 500 sectors can match (State Street Global Advisors, 2026; company dividend disclosures).
3. Check what’s already in your 401(k) or index fund. Anyone holding a total-market or S&P 500 index fund already owns a small slice of ExxonMobil and Chevron; the energy sector’s weight in the S&P 500 rises and falls with oil prices, so a portfolio review during a price spike is a free way to see how much indirect exposure already exists before deciding whether to add more.
4. Don’t ignore the demand side. The most reliable long-run hedge against gasoline price spikes remains using less of it — carpooling, trip-bundling, or a partial shift toward a more fuel-efficient or electric vehicle reduces exposure to the exact volatility described above, and unlike a stock position, it can’t lose value.
Kemetic Minds Analysis
The throughline across every primary-source number here is timing mismatch, not conspiracy. Oil-company profits move with global crude and natural gas benchmark prices on a lag of weeks; gasoline pump prices follow within days; American household budgets absorb the change immediately, with no lag at all. CEO pay at the two U.S. supermajors moved the same direction as profits in the most recent disclosed year — down — which is the compensation system working roughly as designed. What the pay-ratio disclosures actually show is less about any single bad year and more about a structural gap that persists across good years and bad ones: a 200-to-232-to-1 ratio holds whether the company just posted a record year or a 32% decline. For the average American, the practical takeaway from five years of data is that pump prices will keep tracking global crude benchmarks regardless of who is in the White House or which company is setting quarterly records — and the tools available to hedge that exposure, from a single ETF share to a trip to the DMV for a more efficient vehicle, are more accessible than most people realize.
References
- AAA. (2026, July). Gas prices. AAA Fuel Prices. gasprices.aaa.com
- Chevron Corp. (2025). Form DEF 14A [Proxy statement]. U.S. Securities and Exchange Commission. sec.gov
- Chevron Corporation. (2023). Chevron reports full-year 2022 results [Press release]. sec.gov
- Chevron Corporation. (2026, January 30). Chevron reports fourth quarter 2025 results [Press release; Exhibit 99.1 to Form 8-K]. U.S. Securities and Exchange Commission. sec.gov
- Environmental Working Group. (2023, January). Despite record $200 billion profit, Big Oil fights windfall taxes and fair gas price plan [News release]. ewg.org
- Exxon Mobil Corp. (2025). Form DEF 14A [Proxy statement]. U.S. Securities and Exchange Commission. sec.gov
- ExxonMobil Corporation. (2021, February 2). ExxonMobil reports results for fourth quarter 2020 and provides perspective on forward plans [Press release]. corporate.exxonmobil.com
- ExxonMobil Corporation. (2023, January 31). ExxonMobil announces 2022 results [Press release]. sec.gov
- ExxonMobil Corporation. (2026, January 30). ExxonMobil announces 2025 results [Press release]. corporate.exxonmobil.com
- Ipsos. (2026). Two-thirds say rising gas prices have affected their household finances. ipsos.com
- Pew Research Center. (2026a, April 7). Gas prices are Americans’ top concern in Iran war. pewresearch.org
- Pew Research Center. (2026b, April 3). Americans’ shifting views on energy issues. pewresearch.org
- State Street Global Advisors. (2026). Energy Select Sector SPDR Fund (XLE) [Fund fact sheet]. ssga.com
- U.S. Bureau of Labor Statistics. (2026). Oil and gas extraction one of the highest paying U.S. industries. The Economics Daily. bls.gov
- U.S. Energy Information Administration. (2026). U.S. all grades all formulations retail gasoline prices [Data table]. eia.gov
Methodology: All financial figures in this report are drawn directly from ExxonMobil and Chevron’s own SEC filings (10-K annual reports and DEF 14A proxy statements) and official press releases, cross-checked against the U.S. Energy Information Administration’s retail gasoline price series and the U.S. Bureau of Labor Statistics’ Occupational Employment and Wage Statistics program. Public-opinion figures come from Pew Research Center and Ipsos. No figures were estimated, rounded from search snippets, or sourced from Wikipedia. Section 4 is educational information about publicly available investment products, not personalized financial advice; oil and gas prices, and the securities tied to them, can decline as well as rise. Citations follow APA 7th edition format.
📱 Stay Connected

Kemetic Minds Editorial Desk
Verified NewsroomPrimary-sourced investigative intelligence on civil rights, voting rights, federal policy, and consumer protection. Sourced from primary legal filings, government statistics, and direct field reporting.