

KEMETIC MINDS
Data Journalism — Economics Series | July 19, 2026
New Census and Federal Reserve data show U.S. income inequality at its third-highest level on record, with the top 20% of households now taking home more than half of all income while the bottom 20% get just 3.1%. The racial wealth gap remains especially stark — the median Black family holds about 15 cents for every dollar the median white family has. Here’s what the 2025-2026 data actually shows, chart by chart.
1. The Long Climb: Fifty-Seven Years of Rising Inequality
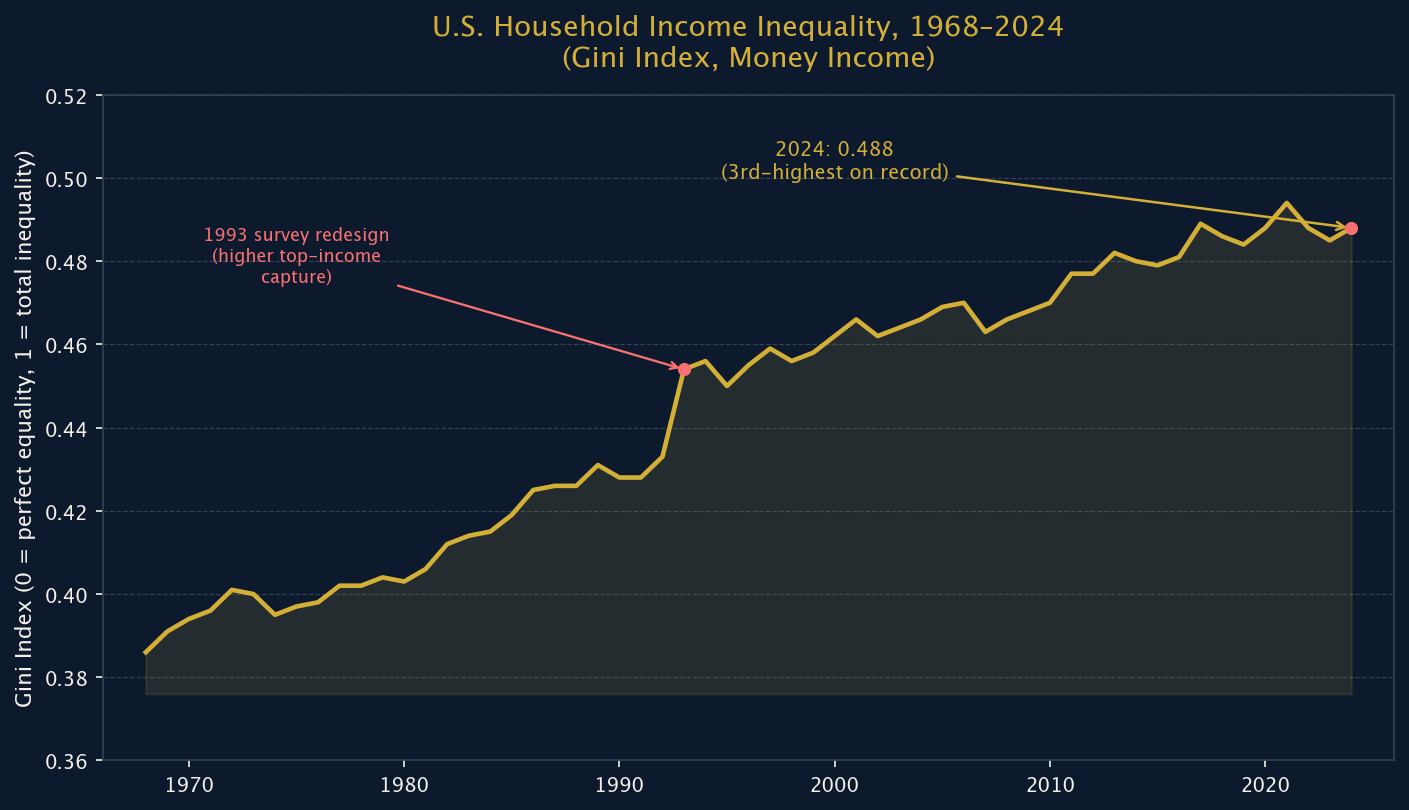
Every September, the Census Bureau quietly publishes the most comprehensive household-income snapshot in the country — and the 2025 edition, covering calendar year 2024, confirms a trend that has now run for more than half a century. The Gini index, the standard 0-to-1 measure of income concentration where 0 is perfect equality and 1 is total inequality, stood at 0.488 in 2024. That is the third-highest reading since the Census Bureau began tracking it in 1967, trailing only 2021 (0.494, boosted by pandemic-era income volatility) and effectively tied with 2020 and 2022 (both 0.488) (Kollar & Scherer, 2025).
The historical arc is the real story. The Gini index sat at 0.394 in 1970 and 0.403 in 1980 — it climbed to 0.462 by 2000, crossed 0.47 by 2010, and has hovered at or above 0.48 for most of the 2020s. Inequality did not spike in a single bad year; it has been a one-way ratchet across five different presidential administrations of both parties, through recessions, expansions, and a pandemic (Kollar & Scherer, 2025). The chart below plots all 57 years of the official Census series.
Figure 1
The Gini Index of U.S. Household Income Inequality, 1968–2024
2. The 2024 Snapshot: Who Actually Got the Income
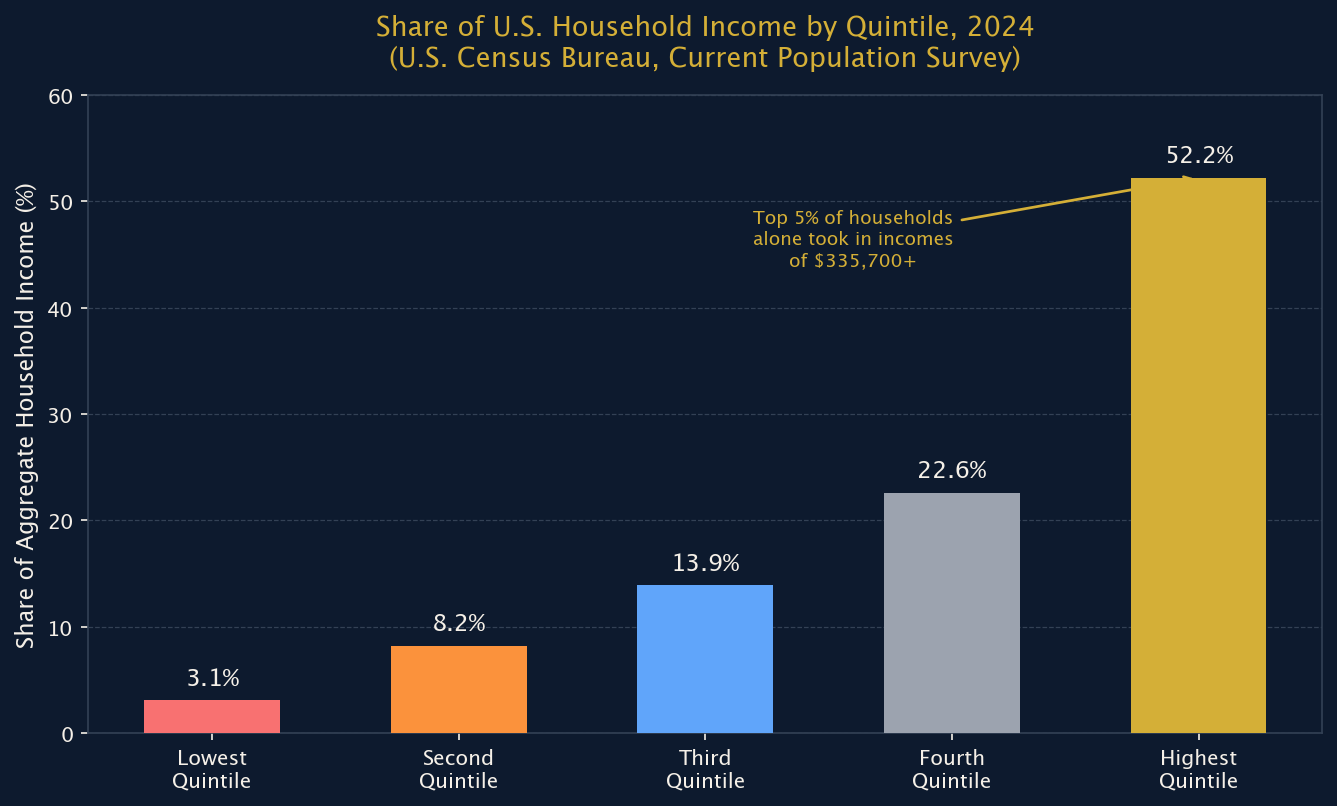
Real median household income was $83,730 in 2024, statistically unchanged from 2023’s $82,690 (Kollar & Scherer, 2025). But medians hide the distribution. The Census Bureau also breaks total national income into five equal-sized quintiles, and the 2024 breakdown is stark: the bottom fifth of households received just 3.1% of all money income, while the top fifth received 52.2% — more than the bottom four-fifths of the country combined. Within that top quintile, the top 5% alone had household incomes of $335,700 or higher (Kollar & Scherer, 2025).
The income percentile ratios tell the same story a different way: a household at the 90th percentile earned 12.61 times as much as a household at the 10th percentile in 2024, up from single digits in the late 1960s. The gap between the median (50th percentile) and the top (90th percentile) — so-called “upper-tail” inequality — grew 2.9% in just the past year alone (Kollar & Scherer, 2025).
Figure 2
Share of U.S. Household Income by Quintile, 2024
3. Wealth Is Even More Concentrated Than Income
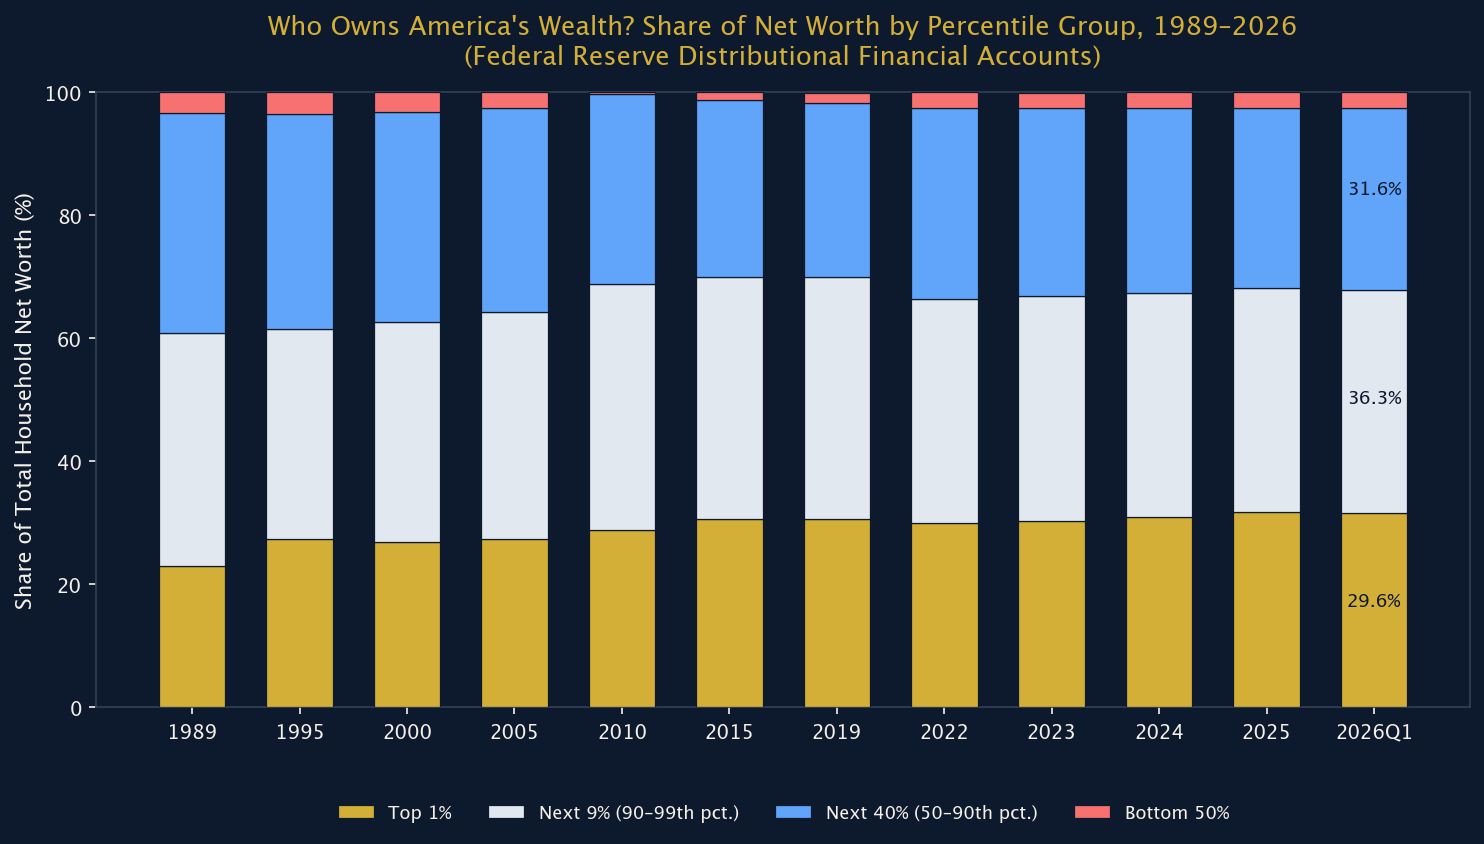
Income inequality is only half the picture. The Federal Reserve’s Distributional Financial Accounts — a quarterly dataset that has tracked household net worth by wealth percentile since 1989 — show an even sharper concentration at the top. As of the first quarter of 2026, the wealthiest 1% of U.S. households held 31.6% of all household net worth. The next 9% (the 90th–99th percentiles) held another 36.3%. Together, the top 10% of American households own roughly 68% of the country’s total wealth. The bottom half of the country — over 60 million households — held just 2.5% (Board of Governors of the Federal Reserve System, 2026).
That imbalance is not new, but it is durable. In 1989, the top 1% held 23.0% of net worth and the bottom half held 3.4%. By 2010, in the aftermath of the housing crash that wiped out home equity for millions of middle-class families, the bottom half’s share had collapsed to just 0.4% before slowly recovering. It has not gotten back above 2.6% since (Board of Governors of the Federal Reserve System, 2026). The OECD’s most recent cross-country comparison found that households in the top 10% of the wealth distribution own more than half (52%) of total wealth on average across member nations — but in the United States, that figure is 79%, among the highest concentrations in the developed world (OECD, 2024).
Figure 3
Who Owns America’s Wealth? Share of Net Worth by Percentile Group, 1989–2026
4. The Racial Wealth Gap Hasn’t Moved
The Federal Reserve’s Survey of Consumer Finances (SCF) — the gold-standard survey of household balance sheets, conducted every three years — remains the best source on wealth by race. Its most recent full results, covering 2022, are still the latest available; the Fed began fieldwork on the 2025 survey in March 2025, but results won’t be published until late 2026 (Federal Reserve Board, 2025). In the 2022 data, the median Black family held $44,890 in net worth versus $284,310 for the median white family — roughly 15 cents for every dollar of white family wealth (Bhutta et al., 2023).
The Census Bureau’s newer annual income data (which, unlike the SCF, is collected every year but measures income rather than wealth) shows the same racial divide persisting into 2024: median Black household income was $56,020 — the lowest of any major racial or ethnic group tracked, and the only group whose income significantly declined (down 3.3%) between 2023 and 2024. White non-Hispanic households had a median of $92,530 and Asian households the highest at $121,700 (Kollar & Scherer, 2025). Income inequality is also higher within the Black population than any other group measured: the Gini index for Black households was 0.509 in 2024, compared to 0.475 for white non-Hispanic households (Kollar & Scherer, 2025).
5. What’s Driving It: The CEO Pay Gap and the Global Comparison
One of the most-cited drivers of top-end inequality is executive compensation. The Economic Policy Institute’s newest analysis, released in September 2025 and covering 2024 pay, found that CEOs at America’s 350 largest public firms were paid 281 times as much as their typical worker in 2024 — average realized CEO compensation was $22.98 million, a 5.9% jump from 2023. That ratio was just 21-to-1 in 1965 and 31-to-1 in 1978; since then, top CEO pay has grown 1,094% (inflation-adjusted) while a typical worker’s compensation has grown just 26% over the same 46 years (Economic Policy Institute, 2025).
The United States is also an outlier internationally. The World Inequality Database, which combines tax records, national accounts, and survey data to estimate income concentration across countries, puts the U.S. top 1% pretax income share at roughly 21% of national income — the highest share among wealthy OECD economies, well above peer nations in Western Europe and Scandinavia, most of which cluster in the 10–14% range (World Inequality Database, 2024). Combined with the SCF and DFA figures above, the pattern across every major U.S. and international data source is the same: income concentration at the top, wealth concentration at the top, and a racial wealth gap that has not meaningfully closed in a generation.
Kemetic Minds Analysis
The headline number that should stick with readers is not any single statistic here, but the consistency across five independent data sources — the Census Bureau’s annual income survey, the Federal Reserve’s quarterly wealth accounts, the Fed’s triennial Survey of Consumer Finances, the Economic Policy Institute’s CEO pay tracker, and the OECD’s cross-country wealth comparison — all pointing the same direction at the same time. This isn’t a single bad data release or a one-year anomaly; it’s a multi-decade structural trend that has survived recessions, recoveries, stimulus checks, and multiple changes in political control of Washington. The most policy-relevant fact in the 2024 Census data may be the smallest one: median income for Black households was the only major demographic group to significantly decline year-over-year, even as the overall economy grew. When the next Survey of Consumer Finances data lands in late 2026, it will be the single most important test of whether the racial wealth gap narrowed at all in the three years since 2022 — or whether, like the overall Gini index, it simply continued its decades-long march upward.
References
- Bhutta, N., Blair, J., Dettling, L., & Moore, K. B. (2023). Changes in U.S. family finances from 2019 to 2022: Evidence from the Survey of Consumer Finances. Federal Reserve Bulletin. federalreserve.gov
- Board of Governors of the Federal Reserve System. (2026). Distributional financial accounts: Shares of wealth by wealth percentile groups. FRED, Federal Reserve Bank of St. Louis. fred.stlouisfed.org
- Economic Policy Institute. (2025, September). CEO pay jumped nearly 6% in 2024: CEOs made 281 times as much as the typical worker. epi.org
- Federal Reserve Board. (2025, February 28). Federal Reserve Board begins 2025 Survey of Consumer Finances [Press release]. federalreserve.gov
- Kollar, M., & Scherer, Z. (2025). Income in the United States: 2024 (Current Population Reports, P60-286). U.S. Census Bureau. census.gov
- U.S. Census Bureau. (2025). Table H-4: Gini indexes for households, by race and Hispanic origin of householder: 1967 to 2024. census.gov
- Organisation for Economic Co-operation and Development. (2024). Income and wealth inequalities: Society at a glance 2024. oecd.org
- World Inequality Database. (2024). United States — Income inequality data. World Inequality Lab. wid.world
Methodology: All figures in this report are drawn directly from primary government and research-organization sources and verified against original data files — the Census Bureau’s official P60-286 report and Table H-4 historical Gini series (downloaded directly from census.gov), the Federal Reserve’s Distributional Financial Accounts via FRED, the Fed’s 2022 Survey of Consumer Finances bulletin, the Economic Policy Institute’s 2025 CEO pay report, the OECD’s Society at a Glance 2024, and the World Inequality Database. No figures were estimated, rounded from search snippets, or sourced from Wikipedia. Citations follow APA 7th edition format.
📱 Stay Connected

Kemetic Minds Editorial Desk
Verified NewsroomPrimary-sourced investigative intelligence on civil rights, voting rights, federal policy, and consumer protection. Sourced from primary legal filings, government statistics, and direct field reporting.