
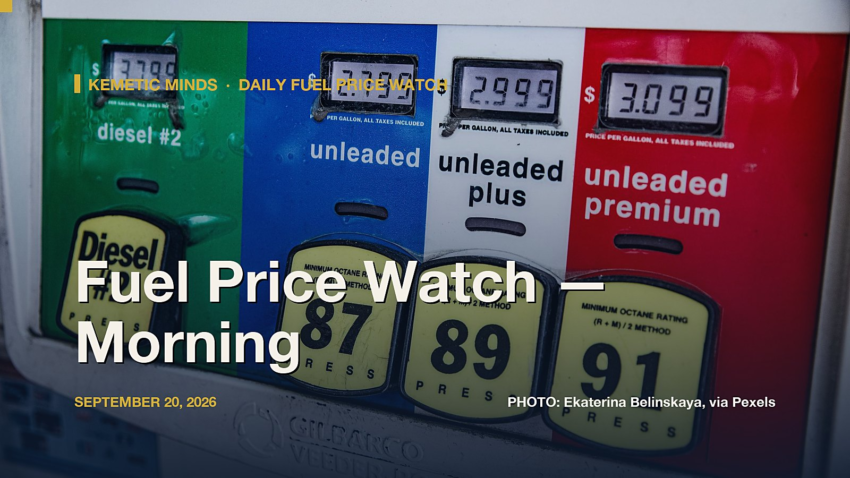
Economics · Daily Fuel Price Watch · Morning Edition · September 20, 2026
National average pump prices as of today, from AAA’s Daily Fuel Gauge Report[1] — plus what’s actually driving those prices at the crude-oil level, what EIA’s own supply data says about whether fuel is running short anywhere, and real, cited ways to cut your own fuel costs while prices stay elevated.
| Grade | Today | Week Ago | Month Ago | Year Ago |
|---|---|---|---|---|
| Regular | $4.4761 | $4.3130 | $4.1044 | $3.1894 |
| Mid-Grade | $4.9680 | $4.8133 | $4.6129 | $3.6817 |
| Premium | $5.3588 | $5.2007 | $4.9954 | $4.0405 |
| Diesel | $6.5050 | $6.2040 | $5.5477 | $3.7002 |
National average pump prices, per gallon. Source: AAA Daily Fuel Gauge Report.[1]
Crude Oil and Why It Moves the Pump Price
West Texas Intermediate (WTI) crude — the main U.S. benchmark — settled at $107.02 per barrel as of September 15, 2026 (up $4.60 from the prior session).[3] Crude is not a side factor in what you pay at the pump — it is the single largest piece of it:
“The cost of crude oil accounted for about 51% of the monthly average U.S. retail on-highway diesel fuel prices from 2004 through 2025.”[4]
That’s the mechanism behind an “oil crisis” showing up in your own household budget: a spike in global crude prices — from OPEC+ supply decisions, a supply disruption, or a demand shock — passes through to diesel and gasoline within days to weeks, well before it ever shows up as a broader inflation number.
Is Fuel Actually Running Short Anywhere?
No verified reports of gas station fuel outages turned up in today’s check of NPR and Al Jazeera’s news feeds, and EIA’s own gasoline and distillate stock levels are rising week-over-week (gasoline +0.4%, diesel +1.5%) — the opposite of what a real physical shortage would show.[2] Prices are high; that is a documented, separate fact from stations running dry, and we do not conflate the two.
The Supply Picture (EIA)
For the week ending September 11, 2026, the U.S. Energy Information Administration reported total gasoline stocks of 207,732 thousand barrels (+0.4% week-over-week) and distillate (diesel) stocks of 107,859 thousand barrels (+1.5%).[2] Diesel’s national average has moved up $0.3010/gal from a week ago and is +76% versus a year ago.[1]
How to Prepare for Higher Prices
Real, cited guidance from fueleconomy.gov, the U.S. Department of Energy and EPA’s joint consumer site[5] — not a generic list, an actual excerpt of their published driving advice:
“Aggressive driving (speeding, rapid acceleration and braking) wastes gas. It can lower your gas mileage by roughly 15% to 30% at highway speeds and 10% to 40% in stop-and-go traffic. 1,2”[5]
Beyond driving habits, the most durable hedge against volatile pump prices is reducing how much you’re exposed to them at all: combining errands into fewer trips, carpooling or transit for a regular commute, and — for a next vehicle purchase — weighing fuel economy specifically against a scenario where prices stay elevated for years, not just today’s number.
How to Verify This Yourself
- AAA’s live national and state-by-state prices: gasprices.aaa.com.
- EIA’s own weekly gasoline/diesel update: eia.gov/petroleum/gasdiesel.
- EIA’s daily WTI and Brent crude spot prices: eia.gov/dnav/pet.
- Real-time, crowd-sourced local station reports: tracker.gasbuddy.com.
References
- AAA. (September 20, 2026). Daily Fuel Gauge Report. gasprices.aaa.com — primary source. ↩
- U.S. Energy Information Administration. (September 11, 2026). Weekly U.S. Ending Stocks of Total Gasoline and Distillate Fuel Oil [Data set]. eia.gov — primary source. ↩
- U.S. Energy Information Administration. (September 15, 2026). Cushing, OK WTI Spot Price FOB [Data set]. eia.gov — primary source. ↩
- U.S. Energy Information Administration. Factors Affecting Diesel Prices. eia.gov/energyexplained — primary source. ↩
- U.S. Department of Energy / U.S. Environmental Protection Agency. Gas Mileage Tips — Driving More Efficiently. fueleconomy.gov — primary source. ↩
Investigative methodology: prices are read directly from AAA’s published national table; stock and crude-price levels are read directly from EIA’s public data series with pandas — no figure is estimated. The crude-price-share quote and the driving tip are each fetched fresh from EIA’s and fueleconomy.gov’s own live pages at run time, not frozen into this script, and quoted verbatim. The fuel-availability section either quotes a real, freshly fetched news item verbatim and cites it, or states plainly that no such report was found; scripts/daily_fuel_report.py never generates or infers a claim about a specific station or region.

Kemetic Minds Editorial Desk
Verified NewsroomPrimary-sourced investigative intelligence on civil rights, voting rights, federal policy, and consumer protection. Sourced from primary legal filings, government statistics, and direct field reporting.